
Google Glass brings the mobile computing to eye level. In one respect this is particularly compelling as it might herald a move away from handset-centric mobile computing and signal the coming of age of augmented reality. Commentators have been excited by the prospect of widespread ownership and the potential applications to business, with market research being no exception. We felt it was necessary to cut through the hype and make an assessment grounded in the here and now.
Google Glass comes under the heading ‘wearables’ which is widely used but rather general. We suggest three categories of capability (as opposed to device). These are ‘wearable sensors’ (measuring biometrics from a worn device), ‘wearable mobile computing’ (the ability to control mobile features from a worn device) and ‘first person media capture’ (capturing video and photos from a worn device). Each of these capabilities alone has significant and different implications for market research, deserving separate consideration. Since Google Glass and other products are likely to have more than one capability, such categorisation also pre-empts likely semantic difficulties.
The devices in our study
Our initial research focused primarily on first-person media capture and in our initial research we found a number of other, more mature worn devices which also capture first person media data. We considered three types of device – wrist-wear (such as Samsung Galaxy Gear), life-blogging cameras (worn round the neck and capturing photos at intervals) and eye-wear (such as Google Glass but also include eye-tracking spectacles). We decided to exclude wrist wear because in essence it offers little more than mobile for media capture. However, we decided to include a life-logging camera (‘Autographer’) because it captures a continu-ous, first-person view, a useful comparison against eye-wear. Finally, we included a pair of eye-tracking spectacles (‘Pupil’) similar to Google Glass in size and cost, also able to capture video but importantly, also capturing data about fixation.
Methodology
In our study, participants were sent shopping trip for about 30 minutes while wearing one or more test devices. We had decided longer-
duration methodologies like diary or journal methodologies, particularly outside the home, were not viable because some people found wearing the eye-wear embarrassing.
We ran fieldwork in March 2014, assisted by Eye Square, a research organisation part owned by Kantar specialising in the field of experience research. There were four cells of 8 respondents: Autographer, Pupil, Google Glass, and mobile (using the participant’s own device). All respondents wore an Auto-grapher round their neck, meaning that aside from respondents in the Autographer cell, the remainder were testing two devices simul-taneously, allowing direct, moment-by-moment comparison between two sets of data.
Respondents were recruited based on a desire to buy a tablet computer. After briefing and technical set up, they went shopping in a large shopping centre for roughly 30 minutes. On their return they were interviewed twice – first without, then with the benefit of reviewing the captured media from the primary test device for their cell.
Our questions were: first, could the media be codified to give us information of value; second, could this process be scaled, for example with software techniques. The data points of interest were: stores visited, brand of phone or tablet in view, point-of-sale material in view and interactions (with store assistants, phones or tablets).
In total we collected 8 hours of video and over 7000 images. The Autographer devices captured an image roughly every 10 seconds, which meant an average of about 200 per trip. The mobile respondents, told to capture ‘moments of significance’ in their decision making process, captured an average of less than 10. The video footage from Glass and Pupil was converted to frames at 1-second intervals, giving over 1000 per respondent.
Results
Most striking from a review of the Glass and Pupil data was how variable the vantage point could be. Objects of interest to respon-dents would sometimes not be fully visible because of the natural tendency to rotate our eye-balls rather than overly stretch the neck. Often, we could see only the top of a tablet viewed by a respondent. Autographer images at the same moment were typically from a lower vantage point, revealing a fuller view of the scene – Autographer images containing a product more frequently had it centred (48%) than Glass (31%). Yet on higher displays products it was difficult to see tablet or phone branding because of the shallow angle – the ‘brand unknown’ code was applied roughly twice as often for Autographer (c.30%) than Glass (c.15%).
Eye Square’s coding team took roughly 10 hours to code the one-second fames for the 8 Google Glass respondents (over 12,000 images in total). The resulting timeline for one respondent (Figure 1) shows stores visited, phones or tablets viewed, point-of-sale (POS) material viewed and interactions (with phone, tablet or store assistant), with colours representing different stores, brands or interactions.
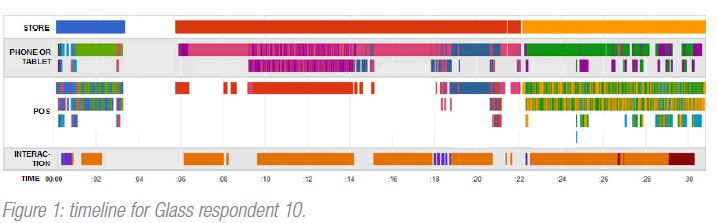
With such a small sample, any quantitative analysis would not be statistically significant but our intention was to demonstrate what would be possible with a larger sample. For example, roughly 50% of respondent time was between stores and 50% of the remaining time split between two popular ones (out of a total of 10). In most stores, phones or tablets were in view over 75% of the time, with Samsung and Apple getting the greatest share. One store displayed only a single brand and almost no POS material (you may guess which). In another, there were disproportionately low levels of inter-action, which a review of the footage revealed was due to it being very busy that day.
A moment-by-moment comparison between Autographer and Glass footage for the same respondents showed that media captured from each device told a similar story. Store visitation in particular was very similar, but there was more divergence where the brand of phones or tablets was difficult to see in images from both. Quantitative analyses confirmed this, with ranking of most com-monly viewed brands being the same but the position of some outliers different.
We also assessed the importance of eye-tracking data to video data by applying the code frame to the video with and without the eye-tracking dots visible. When the dots were not visible, fixation was inferred if the phone or tablet was in the centre of the video. Only 60% of the time did this inference yield the same outcome as the eye-tracking data – i.e. 40% of the time it was probably wrong.
The only sensible comparison to make to the mobile cell was the effect on recall of reviewing the media in the post-shopping interview. Reviewing the eye-wear footage prompted 50% more information about the experience whereas average of 20% more was yielded by reviewing mobile photos. This is a reminder that the data has potential not only as a substitute for questions but also as an adjunct.
To assess how scalable the coding of the data could be, we set out to apply the same code frame using standardly available image recognition software and crowd sourcing. Whilst we could train the software to identify unique POS material as proxy for store visitation, tablets and phones were a problem, being in essence black rectangles with small and elusive logos. Crowd sourcing may have been a cheap way to incorporate human judgment but challenges with privacy and data protection were a barrier, albeit we believe these could be overcome in the future.
There are a number of privacy challenges to be considered as market research assesses first-person media capture. The faces of people unaware research is taking place are captured in the video and although we did not get too many complaints from stores, existing guidelines do not explicitly cover auto-ethnography, making the position on store permissions unclear. As mentioned, the respondents themselves are not always comfortable wearing eye-wear.
Conclusions
Google Glass was the catalyst for our study but is yet to come of age as a research tool. For longer studies, especially taking respondents
outside the home, life-blogging cameras like Autographer would be cheaper, have better battery life, and be more discrete; and for data (such as location or activity) tell a similar story. For studies requiring detail of what people are looking at, and not just what is in view, eye-tracking spectacles like Pupil would be advised.
Image recognition software (and we believe crowd sourcing) can be applied to scale the codification of first-person media data, but in most cases a solution will comprise both software and humans. Creating repeatable processes is the best opportunity, whereby standard training sets are developed for particular products, categories or clients.
Annonse
Annonse