
As an analyst, being part of this wonderful community means constant support by like-minded analysts all around the world. Sharing codes openly also means that analysts can now work faster, be more productive and add more value to their organizations.
I have created a piece of R code based on open data to help you visualize your data analysis in maps. Maps are a sexy way to show results and tell a story. I use R’s base plotting, Lattice plots, the ggplot2 system, the GoogleVis Chart API and interactive javascript visualizations. You can find the entirety of the R code on RPubs, biblogg.no and analysen.no.
Prerequisites
To build your own maps, you will first need to install R (software for statistical computing) and RStudio (a powerful user interface for R) on your machine. You will also need to download the following open data files:
- First, you need a shapefile of the country you want to build a map for. The shapefile format is a popular geospatial vector data format for geographic information system (GIS) software. It is developed and regulated by Esri. For our examples, we will use two shapefiles for Norway: The first shapefile of Norway is available at the website of the Norwegian Mapping Authority (Kartverket). See the references for details. We will use the shapefile called NO_Arealdekke_pol.shp. Don’t forget to read the terms of use.
- The second shapefile is available from the website of the Global Administrative Areas (see references). Download the shapefile format for Norway. You can also download shapefiles of other countries there.
- You may also need a file containing the X-Y coordinates of spatial locations you want to plot. In our case, we will use a file containing the Norwegian postal code areas (see references). I have also used coordinates of a few Norwegian cities in our first example.
Building the Map of Norway in R
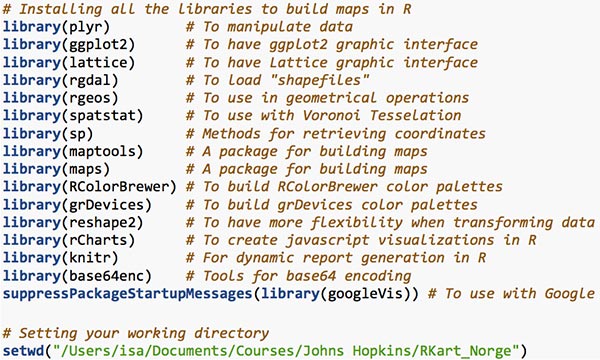
Now, you need to install and load the necessary R packages to build maps. To install packages in R, write the following code: install.packages(“nameOfthePackage”). You need to do this operation for each of the packages listed below. Once this is done, you need to set your work directory with setwd(“your/work/directory”).
Building Maps using R’s Base Plotting System
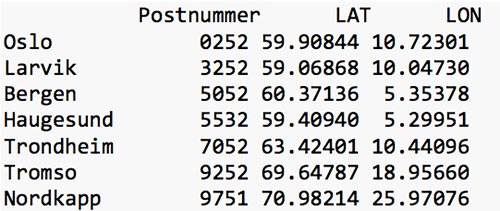
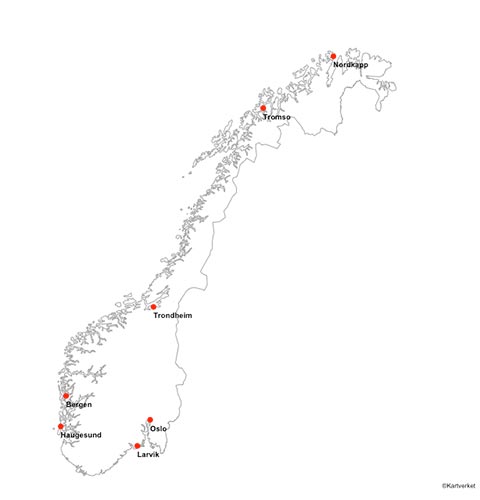
There are several ways to build maps in R. First let’s build a simple map of Norway showing a few Norwegian cities. To do this I have created a simple table (or data frame as it is called in R) called “cities” which contains the latitude and longitude and which looks like this:
We will use R’s base plotting system to create the first map and we will build a code based on the following strategy:
- First, we load the first shapefile of Norway into R from Kartverket
- Secondly, we create a simple data frame with a few Norwegian cities coordinates.
- We check classes and formats of this table and convert it to a spatial object of the right format and class.
- Finally, we plot the first map with R’base plotting system. We plot the cities coordinates, add the city names and a legend.
Performing a Voronoi Tessellation with Base Plotting in R
To build a map showing all postal code areas we will need the help of a Voronoi Tesselation. The code to plot all postal code areas follows this structure:
- First, we plot the map of Norway as previously shown with the first shapefile.
- We plot all the 4463 postal codes coordinates just as we plotted a few cities earlier.
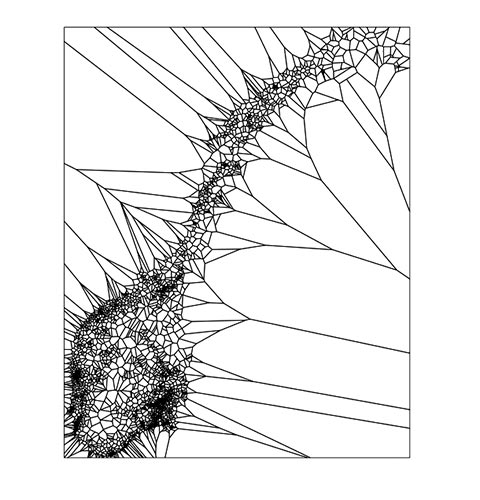
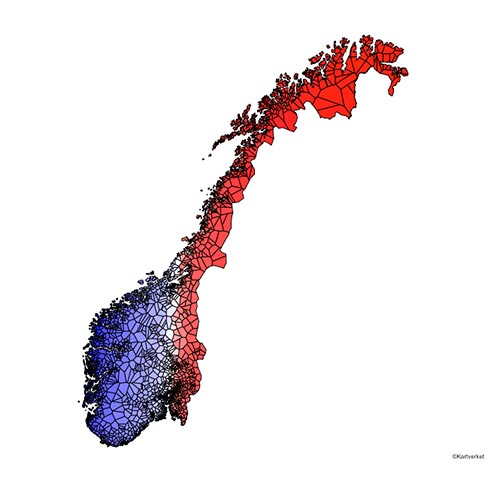
- We perform a Voronoi Tessellation with the ”spatstat” package in R. In mathematics, a Voronoi diagram is a partitioning of a plane into regions based on distance to points in a specific subset of the plane. Put simply, it’s a diagram created by taking pairs of points that are close together and drawing a line that is equidistant between them and perpendicular to the line connecting them. That is, all points on the lines in the diagram are equidistant to the nearest two (or more) source points (see references). After performing a Voronoi Tessellation, we obtain the following map:
- Then we remove all the lines that are plotted outside the borders of Norway.
- Finally, we plot the map of Norway with its flag colors. Each postal code area will get its very own color thanks to R’s color palette packages.
Building Maps in R using the ’sp’ Package (Lattice Plot)
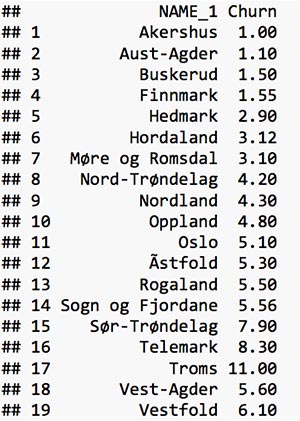
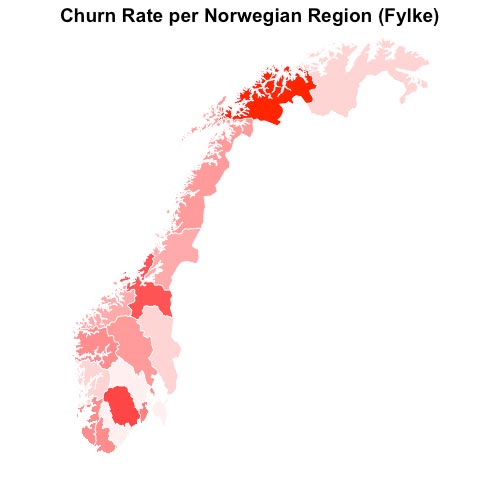
Now let’s say we want to visualize a variable called churn showing the churn rate for each of the 19 Norwegian regions (fylke). The data set looks like this:
We want the results to be shown in a map. We use the R package called ’sp’ to convert the churn rate into a spatial object et voila!
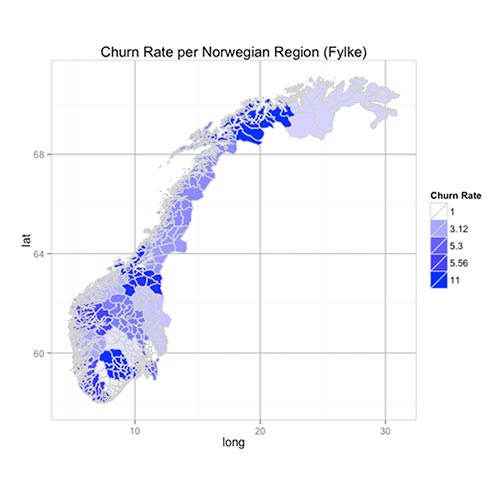
Building Maps in R with the ’ggplot2’ Package
Now, let’s visualize the churn rate dataset from the previous example using the ggplot2 package this time. The results are very similar to the results from the ‘sp’ package.
Building Interactive Maps in R using the ’GoogleVis’ Package
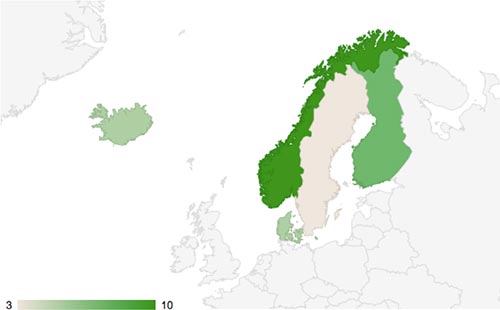
Now let’s say we want to visualize a variable called profit and compare results across Nordic countries. The data frame for this example looks like this:
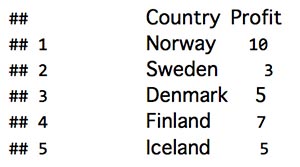
We want the results to be shown in an interactive map. We use the R package called ’Googlevis’ to do this. The basic idea behind the GoogleVis package is:
- The R function creates an HTML page
- The HTML page calls the Google Charts API
- The results are displayed with an interactive HTML graphic
Please note that, you can choose to change the map settings to a European map using region=”150” in the GvisGeoChart command line. The default setting shows a world map. See GoogleVis Examples in the references on how to get started with the GoogleVis package listed in the references.
Building Interactive Maps in R using the ’rChart’ Package
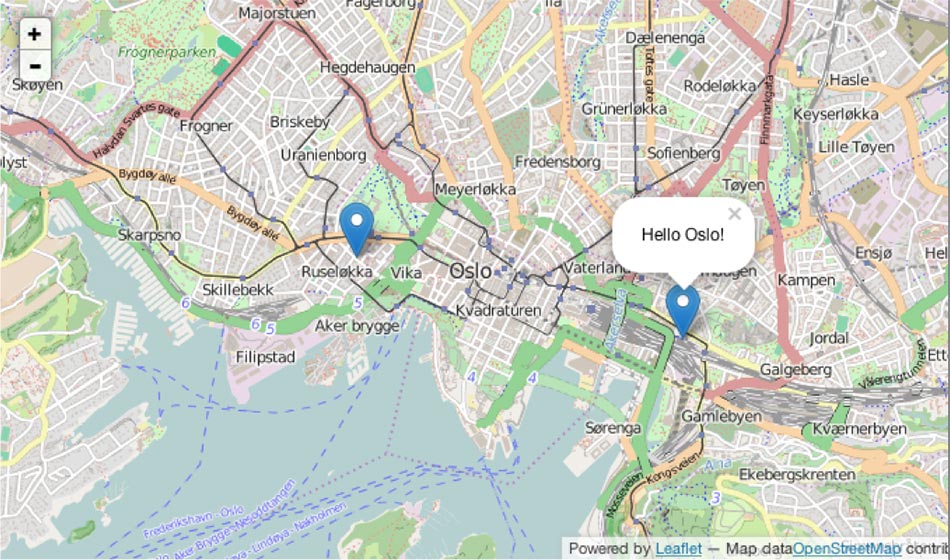
Finally, we want to visualize interactively a street view of Oslo, the capital of Norway, with the rChart package in R and plot some popups. rChart is an incredibly easy way to create interactive javascript visualizations using R with just a few lines of code. See rChart in the references for further details on how to get started with rChart.
Acknowledgements
Thanks to Brian Caffo, Jeff Leek and Roger Peng from the John Hopkins Bloomberg School of Public Health, Department of Bio-statistics. Your data Science Specialization on Coursera inspired me.
Thanks a lot to the Norwegian Mapping Authority for sharing shapefiles with data scientists.
A big big thanks to Karl Ove Hufthammer! His wonderful blog was a great source of inspiration and a main reference when writing this article. The code for the Voronoi Tessellation is all his, I just copied it.
A big thanks to Erik Bolstad for making the csv files with postal code coordinates available in Norway.
Thanks to the Global Administrative Areas for giving access to shapefiles of the world.
References
Datasets and Shapefiles
https://www.bedreinnsikt.no/innhold/datasett-postnummer https://www.erikbolstad.no/postnummer-koordinatar/txt/postnummer.csv ttp://www.kartverket.no/Documents/Kart/N50-N5000%20Kartdata/33_N5000_shape.zip https://gadm.org/download
Voronoi Tessellation
https://en.wikipedia.org/wiki/Voronoi_diagram
GoogleVis Examples
https://cran.r-project.org/web/packages/googleVis/vignettes/googleVis_examples.html
rCharts Examples
Annonse

Annonse